# Load example population
sampling_frame <- nrba::involvement_survey_popUntil the last few months, the cube method to me was some arcane concept that I vaguely knew could be useful but seemed too complicated to bother learning just yet. Recently, though, I attended an interesting webinar from Yves Tillé discussing the cube method for sampling and its adoption by some official statistical agencies.1 After hearing the talk, I read the underlying paper “Ten years of balanced sampling with the cube method: An appraisal”; it’s a good read and contains most of the statistical points made in this blog post. Based on this experience, I now see the cube method as an exciting tool that has many potential applications for even run-of-the-mill survey projects, and I’d like to get some applied experience using it.
One of the appealing points that Yves Tillé made about the cube method is that it can be used to implement multiway stratification. With the cube method, we can specify the sample size for each category of several variables without having to specify the sample size for all of the combinations of different variables. This blog post provides some short explanations and demos for how we can use cube method to draw stratified samples.
Balanced Sampling
In a Nutshell
The cube method provides a very flexible implementation of balanced sampling. Many common sampling methods, such as stratified sampling or PPS sampling with fixed sample sizes, are special cases of balanced sampling. So what is balanced sampling? In a nutshell, a balanced sampling design ensures that the samples selected under the design always result in estimates that align with known characteristics of the population. With a balanced sampling design, we have a balanced equation where weighted sums in our sample match known totals for our population.
\[ \sum_{i=1}^{n} w_ix_i = \sum_{i=1}^{N} x_i \]
For example, balancing on gender and age means that weighted sample estimates for gender and age categories should match the population distributions in every sample. Balancing can be exact or we can tolerate some small imperfection in the balancing. The cube method is a particular algorithm for selecting random balanced samples, either exactly or nearly exactly. It has the added benefits of: (1) allowing us to select samples without replacement, and (2) allowing us to exactly specify each population element’s probability of being included in a sample.
Notation
For understanding balanced sampling, we’ll write out balancing conditions as follows:
\[ \sum_{i \in s} \frac{\mathbf{z}_i}{\pi_i} = \sum_{i \in U} \mathbf{z}_i \]
Here, \(\mathbf{z}\) is an auxiliary variable (or vector of auxiliary variables) whose value is known for every element \(i\) in the population \(U\). The inclusion probability for element \(i\) is \(\pi_i\), and the sample weight is defined as \(\pi_i^{-1}\).
Stratified Sampling as a Special Case of Balanced Sampling
Stratified simple random sampling is a special case. Suppose we have \(H\) strata, and the \(h\)-th stratum has an allocated sample size of \(n_h\); that is, every sample we select should have \(n_h\) elements from the \(h\)-th stratum. For a given stratum \(h\), we define an indicator variable \(z^{h}_{i}\) for the \(h\)-th stratum, where \(z^{h}_{i}=\pi_i\) if element \(i\) is in stratum \(h\) and \(z^{h}_{i}=0\) if element \(i\) is not in stratum \(h\). In this case \(\pi_i = \frac{n_h}{N_h}\).
Then we have:
\[ \begin{aligned} \sum_{i \in s} \frac{z^h_i}{\pi_i} &= \sum_{i \in U} z^h_i \\ \sum_{i \in s_h} \frac{\pi_i}{\pi_i} &= N_h \frac{n_h}{N_h} \\ \sum_{i \in s_h} 1 &= n_h \\ \end{aligned} \]
The balancing condition in that example means that the stratum sample size for stratum \(h\) always matches the fixed value \(n_h\).
More generally though, suppose we aren’t simply doing simple random sampling sampling within strata. For the population, we have an inclusion probability \(\pi_i, \space i \in U\) which might vary within a given stratum. The condition of a fixed sample size for the stratum can still be expressed as a balancing condition based on the variable \(z_i\) we defined earlier (\(z^h_i =\pi_i \space \text{ if }i \in U_h \text{, }z^h_i = 0 \text{ otherwise})\).
\[ \begin{aligned} \sum_{i \in s} \frac{z^h_i}{\pi_i} &= \sum_{i \in U} z^h_i \\ \sum_{i \in s_h} 1 &= \sum_{i \in U_h} \pi_i \\ \end{aligned} \]
This balancing condition means that the stratum sample size is fixed at the population total of inclusion probabilities for the stratum.
Key Takeaway
The key takeaway here is that stratified sampling with a fixed sample size can be expressed as balancing on variables defined as strata indicators multiplied by inclusion probabilities. To obtain a fixed sample size for a stratum, the key is to define the inclusion probabilities so that the population sum of inclusion probabilities matches the desired sample size.
Multiway Stratification: An Example with R
A benefit of framing stratification in terms of a balancing condition is that it becomes quite natural to form overlapping strata (a method called multiway stratification). In other words, it helps us specify fixed sample sizes for categories of different variables without having to specify fixed sample sizes for combinations of different variables. For example, we can stratify on gender and race without having to form strata based on cross-classifications of gender and race.
All we have to do is form one auxiliary variable for each category of each stratifying variable, and then balance on those variables.
Creating an Example Population
Let’s consider an example population. We’ll look at a simulated population of parents of students with disabilities, available as a dataset in the ‘nrba’ package.
Determining the Sample Design
Let’s say we want to draw a sample of 500 parents, stratifying based on their children’s demographic characteristics. Suppose we want to stratify based on both sex and race, using proportional allocation. Then we simply need to create indicator variables for each sex category and for each race category, and multiply those by inclusion probabilities. For the inclusion probabilities, we’ll use equal probability sampling: \(\pi_i = n/N = 500/20,000\).
# Calculate sampling probabilities
n <- 500
N <- nrow(sampling_frame)
probs <- rep(n/N, times = N)

sampling_frame[['prob']] <- probs
Note that this results in proportional allocation to strata, since the population sum for the balancing variable \(z^{h}\) corresponding to stratum \(h\) will be \(\sum_{i \in U} z^{h}_i = \sum_{i \in U_h} \pi_i = \frac{n}{N}N_h = n \left(\frac{N_h}{N}\right)\). Below, we can see these strata allocations.
library(dplyr)

sampling_frame |>
  group_by(STUDENT_SEX) |>
  summarize(n_h = sum(prob),
            N_h = n()) |>
  ungroup()
# A tibble: 2 × 3
STUDENT_SEX n_h N_h
<chr> <dbl> <int>
1 Female 183. 7336
2 Male 317. 12664sampling_frame |>
group_by(STUDENT_RACE) |>
summarize(n_h = sum(prob),
N_h = n()) |>
ungroup()# A tibble: 7 × 3
STUDENT_RACE n_h N_h
<chr> <dbl> <int>
1 AM7 (American Indian or Alaska Native) 4.45 178
2 AS7 (Asian) 5.15 206
3 BL7 (Black or African American) 70.6 2823
4 HI7 (Hispanic or Latino Ethnicity) 94.1 3763
5 MU7 (Two or More Races) 12.6 504
6 PI7 (Native Hawaiian or Other Pacific Islander) 3.5 140
7 WH7 (White) 310. 12386Note that these are non-integer allocations. If we tweaked the inclusion probabilities we could ensure integer allocations. But with the non-integer allocations, the realized sample sizes will generally be very close to the allocation, minus some rounding error.
After defining these balancing variables, we can select a balanced sample using the cube method.
This is a nice example of how “simple random sampling (SRS)” is distinct from “equal probability of selection method (EPSEM)” sampling. All of the population units have an equal probability of selection (i.e., this is an EPSEM sample design), but it is not a SRS design since some samples (namely, well-balanced samples) are more likely to be selected than others (poorly-balanced samples).
# Calculate sampling probabilities
n <- 500
N <- nrow(sampling_frame)
probs <- rep(n/N, times = N)

sampling_frame[['prob']] <- probs

# Create indicator variables (0/1) for each stratum
strata_indicators <- model.matrix(
  object = ~ -1 + STUDENT_SEX + STUDENT_RACE,
  data = sampling_frame
)

# Multiply the indicators by inclusion probabilities
vars_to_balance <- diag(probs) %*% strata_indicators
Here’s what our balancing variables look like. There’s one variable for each sex or race category.
colnames(vars_to_balance)[1] "STUDENT_SEXFemale"
[2] "STUDENT_SEXMale"
[3] "STUDENT_RACEAS7 (Asian)"
[4] "STUDENT_RACEBL7 (Black or African American)"
[5] "STUDENT_RACEHI7 (Hispanic or Latino Ethnicity)"
[6] "STUDENT_RACEMU7 (Two or More Races)"
[7] "STUDENT_RACEPI7 (Native Hawaiian or Other Pacific Islander)"
[8] "STUDENT_RACEWH7 (White)" And each variable is simply an indicator for a given category, multiplied by the sampling probabilities (0.25 = 500/20000).
cbind(
  sampling_frame[c("STUDENT_SEX")],
  vars_to_balance[,1:2]
) |> head(5)
STUDENT_SEX STUDENT_SEXFemale STUDENT_SEXMale
1 Male 0.000 0.025
2 Female 0.025 0.000
3 Female 0.025 0.000
4 Male 0.000 0.025
5 Female 0.025 0.000cbind(
sampling_frame[c("STUDENT_RACE")],
vars_to_balance[,3]
) |> head(5) STUDENT_RACE vars_to_balance[, 3]
1 MU7 (Two or More Races) 0.000
2 AS7 (Asian) 0.025
3 AS7 (Asian) 0.025
4 MU7 (Two or More Races) 0.000
5 WH7 (White) 0.000Selecting the Sample
We’ll use the cube method as implemented by the sampling package in R from Yves Tillé and Alina Matei.
library(sampling)

# Select the sample
sample_indicators <- samplecube(
  X = vars_to_balance, # Matrix of balancing variables
  pik = probs,         # Vector of inclusion probabilities
  comment = FALSE,     # Whether to print details of flight and landing
  method = 1           # Use linear programming for landing phase
)

# Get the data for the selected sample
selected_sample <- getdata(
  sampling_frame,
  sample_indicators
)
In an actual survey, it’s a good idea to use samplecube(comment = TRUE) so you can see details of how the cube method was executed. Also, where possible, it’s good to use samplecube(method = 1), but for a particularly large frame and sample size, samplecube(method = 2) is much faster.
Let’s see how our sample distributions for sex and race compare to the population. Note that every population member had the same sampling probability, and so in this example the unweighted and weighted percentages always match.
inner_join(
  selected_sample |> count(STUDENT_SEX, name = "n") |> mutate(samp_pct = n/sum(n)),
  sampling_frame |> count(STUDENT_SEX, name = "N") |> mutate(pop_pct = N/sum(N))
)
STUDENT_SEX n samp_pct N pop_pct
1 Female 184 0.368 7336 0.3668
2 Male 316 0.632 12664 0.6332inner_join(
selected_sample |> count(STUDENT_RACE, name = "n") |> mutate(samp_pct = n/sum(n)),
sampling_frame |> count(STUDENT_RACE, name = "N") |> mutate(pop_pct = N/sum(N))
) STUDENT_RACE n samp_pct N pop_pct
1 AM7 (American Indian or Alaska Native) 4 0.008 178 0.00890
2 AS7 (Asian) 6 0.012 206 0.01030
3 BL7 (Black or African American) 71 0.142 2823 0.14115
4 HI7 (Hispanic or Latino Ethnicity) 94 0.188 3763 0.18815
5 MU7 (Two or More Races) 12 0.024 504 0.02520
6 PI7 (Native Hawaiian or Other Pacific Islander) 4 0.008 140 0.00700
7 WH7 (White) 309 0.618 12386 0.61930These sample sizes all match the allocations we determined earlier (plus or minus 1 person due to the use of non-integer allocations). And the sample and population distributions match almost perfectly for both race and sex. Isn’t that nice?
Allocating Sample Sizes to Obtain an Expected Number of Completes
When planning a survey, we often have a certain number of completes that we want to obtain. To get those completes, we have to sample sufficiently many people such that, even after many of them decline to respond to the survey, we end up with the target number of completes we want. Typically, we do this by coming up with some preliminary estimate of the response rate for the survey, \(\hat{RR}\), and to get our target number of completes \(n^{\star}\), we sample \(n=n^{\star}/\hat{RR}\) cases.
With balanced sampling, we can frame this in terms of predicted response propensities for each case in the population, \(\hat{p}_i, \space i \in U\). If we want to obtain an expected number of completes, then we use these response propensities in defining the sampling probabilities. For example, if we begin with an equal probability sample and then adjust the design to make sure we get \(n^{\star}\) completes, we would define our inclusion probabilities as follows:
Using a predicted overall response rate is a special case where the \(\hat{p}_i\) is assumed to be the same for every \(i \in U\).
\[ \pi_i = \frac{n^{\star}}{N} \frac{1}{\hat{p}_i} \]
More generally, the key is to define our inclusion probabilities with two components:
\(\pi_i^{\star}\): the desired probability of individual \(i\) being in the responding sample (i.e., the sample obtained from selecting a random sample and then experiencing nonresponse).
\(\hat{p}_i\): our prediction of whether individual \(i\) responds to the survey.
Using these two components, we define the sampling probability as \(\pi_i = \pi_i^{\star} \times \hat{p}_i^{-1}\). Then our expected number of completes will be (approximately) the population sum \(\sum_{i \in U} \pi_i\).
Click for an Explanation of Why This Works
To see why, let’s denote \(I_i\) for a 0/1 indicator for whether population element \(i\) is randomly sampled and denote \(R_i\) for a 0/1 indicator for whether that person responds to the survey if they’re sampled. We’ll denote \(p_i\) the probability that they respond if selected for the survey (i.e., \(E(R_i|I_i=1)=p_i\)), which when designing the survey we predict with \(\hat{p}_i\).
In the example where we set \(\pi_i = \frac{n^{\star}}{N} \frac{1}{\hat{p}_i}\), then our expected number of completes is:
\[ \begin{aligned} E(n_{completes}) &= E \left( \sum_{i \in U} I_i R_i \right) \\ &= \sum_{i \in U} \pi_i p_i \\ &= \sum_{i \in U} \pi^{\star}_i \hat{p}_i^{-1} p_i \end{aligned} \]
If our predictions \(\hat{p}\) are good, then we’ll have \(\hat{p}_i^{-1} p_i \approx 1\) in which case:
\[ \begin{aligned} E(n_{completes}) &= \sum_{i \in U} \pi^{\star}_i \\ \end{aligned} \]
For the example where we defined \(\pi^{\star} = n^{\star}/N\), this gives \(E(n_{completes})=n^{\star}\).
Caution
One important limitation here is that if \(\hat{p}_i\) is very small, then we might end up with \(\pi_i > 1\), which is of course meaningless. So in practice, it would be necessary to cap \(\pi_i\) at \(1\) or some other number close to \(1\), and then increase the inclusion probabilities of other units \(j \neq i\).
Guess who just discovered how easy it is to use callout boxes in Quarto?
The Application to Multiway Stratification
The individual predictions approach \(\hat{p}_i\) is useful for multiway stratification. In the usual one-way stratification approach, we typically assume that response propensities are constant within each stratum. But with multiway stratification, that assumption can result in a logical contradiction. For example, if we assume that all people over age 65 are 20% likely to respond to the survey and all women are 15% likely to respond to the survey, then we end up with a logical contradiction when considering the population category of women over age 65. So with multiway stratification, we need to use predicted response propensities that are either constant across strata or vary within a given stratum.
For example, using historical survey data, we can fit a response propensity model using region, sex, and age category as predictors and use those to make response propensity predictions for every individual on our sampling frame. That’s much simpler than, say, stratifying our sample based on cross-classifications of region, sex, and age and then making predictions separately for each cross-classification and coming up with sample size allocations for each detailed cross-classification.
An Example with R
Creating a Frame with Response Propensities
We’ll again consider the parent involvement survey datasets from the ‘nrba’ package. We want to select a multiway stratified from the sampling frame, which is named involvement_survey_pop. This frame lists the parents of students, along with demographic information about the students.
sampling_frame <- nrba::involvement_survey_popHowever, the survey is subject to nonresponse, and the probability of responding to the survey depends on whether the parent has an email address listed on the frame and is also related to the race/ethnicity of the students. The R code chunk below defines the response propensities and adds them to the data frame.
Show R code
# Fix the coefficients of the model
model_coefs <- c(
  `(Intercept)` = 1.03,
  `STUDENT_RACEAS7 (Asian)` = -0.36,
  `STUDENT_RACEBL7 (Black or African American)` = -0.41,
  `STUDENT_RACEHI7 (Hispanic or Latino Ethnicity)` = -1.74,
  `STUDENT_RACEMU7 (Two or More Races)` = -0.37,
  `STUDENT_RACEPI7 (Native Hawaiian or Other Pacific Islander)` = 0,
  `STUDENT_RACEWH7 (White)` = -0.31,
  `PARENT_HAS_EMAILNo Email` = -0.13
)

# Create predictor variables (0/1 indicators) and multiply by coefficients
log_odds <- model.matrix(
  object = ~ STUDENT_RACE + PARENT_HAS_EMAIL,
  data = sampling_frame
) %*% model_coefs

# Convert log-odds to probability scale
sampling_frame[['RESP_PROB']] <- plogis(log_odds)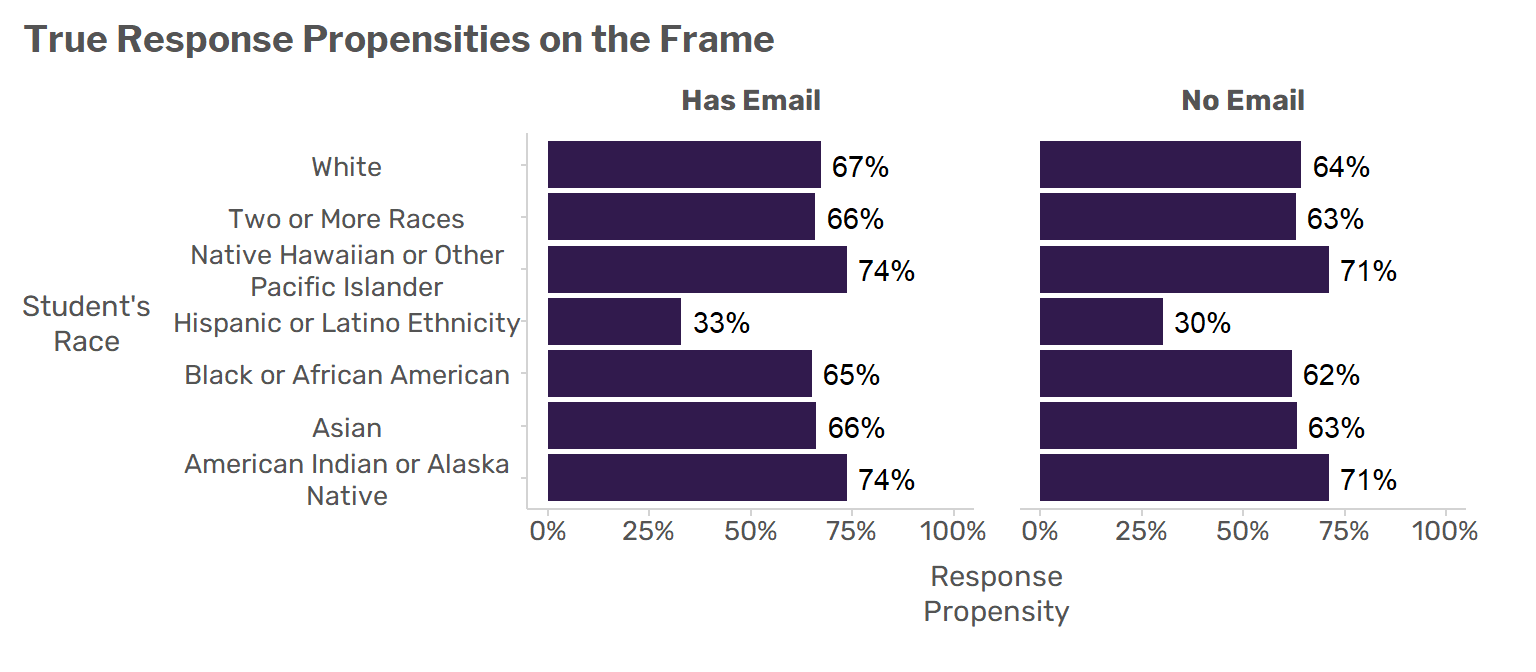
Predicting Response Propensities from a Previous Sample
Suppose we’ve already conducted a survey with this population and we want to use that prior experience to predict response propensities for individuals on the sampling frame. For this example, we’ll use the nrba package dataset involvement_survey_str2s, which is a complex sample that was selected from this frame and which was subject to nonresponse according to the model above. We’ll use this prior survey to fit a response propensity model. The model will be based on student race and sex; note, the model is not the true response propensity model (which we never really know in practice).
Show R code
library(survey)
library(nrba)

# Describe the survey design
previous_sample <- svydesign(
  data    = involvement_survey_str2s,
  weights = ~ BASE_WEIGHT,
  strata  = ~ SCHOOL_DISTRICT,
  ids     = ~ SCHOOL_ID             + UNIQUE_ID,
  fpc     = ~ N_SCHOOLS_IN_DISTRICT + N_STUDENTS_IN_SCHOOL
)

# Fit a model
response_propensity_model <- svyglm(
  design = previous_sample,
  formula = I(RESPONSE_STATUS == "Respondent") ~ STUDENT_SEX + STUDENT_RACE,
  family  = quasibinomial()
)

# Add model predictions to the frame
sampling_frame[['PRED_RESP_PROB']] <- predict(
  response_propensity_model,
  newdata = sampling_frame,
  type = "response"
) |> as.numeric()
As we can see below, the model is OK but far from perfect.

Allocating Sample Sizes
Our goal is for the responding sample to fulfill the following objectives:
A total number of completes equaling \(n^{\star} = 5000\)
Obtain 50 respondents for each category of race/ethnicity and each sex category.
Given the constraints above, the respondents should have distributions for race/ethnicity and for sex which are as close as possible to the population distributions.
With balanced sampling, our tool for achieving these goals is our sampling probabilities \(\pi_i, \space i \in U\). If we define those correctly based on our predicted response propensities, then we can use the cube method to select a sample that will achieve our goals.
As a starting point, let’s consider what would happen if we used equal-probability sampling, with \(\pi_i = \frac{n^{\star}}{N}=\frac{5,000}{20,000}\). In the table below, we list below the resulting sample sizes and the predicted number of completes for each race category. Unfortunately, some categories are short of our target minimum of 50 completes.
n_star <- 5000
N <- nrow(sampling_frame)

sampling_frame[['pi_star']] <- n_star / N

sampling_frame |>
  group_by(STUDENT_RACE) |>
  summarize(
    n = sum(pi_star),
    n_pred_completes = sum(pi_star * PRED_RESP_PROB)
  )
# A tibble: 7 × 3
STUDENT_RACE n n_pred_completes
<chr> <dbl> <dbl>
1 AM7 (American Indian or Alaska Native) 44.5 37.4
2 AS7 (Asian) 51.5 40.7
3 BL7 (Black or African American) 706. 505.
4 HI7 (Hispanic or Latino Ethnicity) 941. 316.
5 MU7 (Two or More Races) 126 99.8
6 PI7 (Native Hawaiian or Other Pacific Islander) 35 35.0
7 WH7 (White) 3096. 2026. To ensure we get enough respondents, we need to increase the sampling rate for some race categories. We’ll define a new variable defined as \(\pi^{\star}_{min,h} = 50 \times \left[ \sum_{i \in U_h}\hat{p}_i \right]^{-1}\). This gives a minimal inclusion probability in each stratum needed to obtain 50 completes (on average), since \(E(n_{completes})=\sum_{i \in U} \pi^{\star}_{min,i} \times\hat{p_i} = 50\).
sampling_frame <- sampling_frame |>
  group_by(STUDENT_RACE) |>
  mutate(
    pi_star_min_race = 50 / sum(PRED_RESP_PROB)
  )
We can compare the original, overall sampling probability \(\pi^{\star}\) to the sampling rates we would actually need in order to get 50 completes. As we can see below, for some race/ethnicity categories with small population sizes, we would need to increase the sampling rate to get at least 50 completes.
Show R code
sampling_frame |>
    group_by(STUDENT_RACE) |>
    summarize(
      pi_star = unique(pi_star),
      pi_star_min = unique(pi_star_min_race)
    )
# A tibble: 7 × 3
STUDENT_RACE pi_star pi_star_min
<chr> <dbl> <dbl>
1 AM7 (American Indian or Alaska Native) 0.25 0.334
2 AS7 (Asian) 0.25 0.307
3 BL7 (Black or African American) 0.25 0.0248
4 HI7 (Hispanic or Latino Ethnicity) 0.25 0.0395
5 MU7 (Two or More Races) 0.25 0.125
6 PI7 (Native Hawaiian or Other Pacific Islander) 0.25 0.357
7 WH7 (White) 0.25 0.00617So now let’s recalculate our sampling probabilities as follows:
- For individuals where \(\pi^{\star}_{min,i} >= \pi^{\star}_i\) for at least one \(h\), we’ll set their sampling probability \(\pi_i = \pi^{\star}_{min,i}\). These are the individuals who are being oversampled to ensure that every stratum has a large enough number of expected respondents.
Note that we can do this for multiple stratification variables: we just work out the probability \(\pi^{\star}_{min,k,i}\) for each variable \(k\) and then take the maximum: \(\pi^{\star}_{min,i} = \max_{k}{\left( \pi^{\star}_{min,k,i} \right)}\)
sampling_frame <- sampling_frame |>
  mutate(
    pi_i = ifelse(pi_star_min_race >= pi_star,
                  yes = pi_star_min_race,
                  no  = NA)
)- Then calculate the sum of \(\pi_i\) across all of those individuals. Denote that sum \(n_a\). This is the expected number of completes coming from the cases whose inclusion probabilities needed to be increased in order to ensure enough completes are obtained for their strata.
n_a <- sum(sampling_frame$pi_i, na.rm = TRUE)

round(n_a, digits = 2) |> print()
[1] 172.76- For everyone else, we want to obtain \(n_b = n^{\star} - n_a\) completes. Here, \(n_b = 4827.24\). The population size for “everyone else” here is denoted \(N_b\).
n_b <- n_star - n_a
print(n_b)
[1] 4827.237N_b <- sum(is.na(sampling_frame$pi_i))
print(N_b)[1] 19476- For “everyone else”, we’ll define the sampling probability as \[\pi_i = \frac{n_b}{N_b}\times \frac{1}{\hat{p}_i}\]. This means that we should get about \(n_b\) completes from this group.
sampling_frame <- sampling_frame |>
  mutate(
    pi_i = ifelse(
      test = is.na(pi_i),
      yes  = (n_b / N_b) * (1/PRED_RESP_PROB),
      no   = pi_i
    )
  )
Let’s make sure that all of the probabilities are between \(0\) and \(1\) and that this should give us the expected number of completes we need.
sampling_frame |>
  summarize(
    min = min(pi_i),
    max = max(pi_i),
    pred_n_completes = sum(pi_i * PRED_RESP_PROB)
  )
# A tibble: 7 × 4
STUDENT_RACE min max pred_n_completes
<chr> <dbl> <dbl> <dbl>
1 AM7 (American Indian or Alaska Native) 0.334 0.334 50
2 AS7 (Asian) 0.307 0.307 50
3 BL7 (Black or African American) 0.344 0.352 700.
4 HI7 (Hispanic or Latino Ethnicity) 0.724 0.764 933.
5 MU7 (Two or More Races) 0.311 0.316 125.
6 PI7 (Native Hawaiian or Other Pacific Islander) 0.357 0.357 50
7 WH7 (White) 0.375 0.385 3070.Looks good!
Caution
In practice, we might want to oversample even more just to make it unlikely that we end up with less than 50 completes.
Selecting our Sample using the Cube Method
Now we’ll draw a multiway stratified sample using the cube method. As we saw earlier, we need to first define balancing variables. These are simply indicators for sex and race categories, multiplied by the inclusion probabilities.
# Create indicator variables (0/1) for each stratum
strata_indicators <- model.matrix(
  object = ~ -1 + STUDENT_SEX + STUDENT_RACE,
  data = sampling_frame
)

# Multiply the indicators by inclusion probabilities
vars_to_balance <- diag(sampling_frame$pi_i) %*% strata_indicators
Now we select the sample.
library(sampling)

# Select the sample
sample_indicators <- samplecube(
  X = vars_to_balance,       # Matrix of balancing variables
  pik = sampling_frame$pi_i, # Inclusion probabilities
  comment = FALSE,           # Whether to print details of flight and landing
  method = 1                 # Use linear programming for landing phase
)

# Get the data for the selected sample
selected_sample <- getdata(
  sampling_frame,
  sample_indicators
)
Let’s see how many respondents we would expect to get from this sample based on our predicted response propensities.
selected_sample |>
  group_by(STUDENT_RACE) |>
  summarize(
    n = n(),
    PREDICTED_RESPONDENTS = round(
      sum(PRED_RESP_PROB) # Sum of **predicted** propensities
    )
  )
# A tibble: 7 × 3
STUDENT_RACE n PREDICTED_RESPONDENTS
<chr> <int> <dbl>
1 AM7 (American Indian or Alaska Native) 60 50
2 AS7 (Asian) 63 50
3 BL7 (Black or African American) 978 700
4 HI7 (Hispanic or Latino Ethnicity) 2777 933
5 MU7 (Two or More Races) 158 125
6 PI7 (Native Hawaiian or Other Pacific Islander) 50 50
7 WH7 (White) 4692 3070Look at that- we got a sample which we think should yield (on average) exactly the number of respondents we wanted!
Of course, when we put together our sampling design, we relied on predicted response propensities from a model, and so our predictions will of course be wrong. So we actually will end up getting something different. Let’s see what we get.
selected_sample |>
  group_by(STUDENT_RACE) |>
  summarize(
    n = n(),
    EXPECTED_RESPONDENTS = round(
      sum(RESP_PROB) # Sum of **actual** propensities
    )
  )
# A tibble: 7 × 3
STUDENT_RACE n EXPECTED_RESPONDENTS
<chr> <int> <dbl>
1 AM7 (American Indian or Alaska Native) 60 44
2 AS7 (Asian) 63 41
3 BL7 (Black or African American) 978 631
4 HI7 (Hispanic or Latino Ethnicity) 2777 904
5 MU7 (Two or More Races) 158 104
6 PI7 (Native Hawaiian or Other Pacific Islander) 50 37
7 WH7 (White) 4692 3135Well, looks like we’d actually come up a bit short of 50 in some of the race categories, since the actual response propensities are lower than what we predicted when we put together the sample design. So the takeaway here is to build in a little room for error: we should oversample a bit more than the propensity model tells us to, in case the model is too optimistic.
Tip
For a large, expensive survey, you would probably want to use an even more sophisticated method for assigning the sampling probabilities for multiway stratification. There’s a nice 2008 paper in Survey Methodology from Falorsi and Righi on some methods.
Footnotes
I can’t find a public video of this webinar, but you can see a video of a closely-related talk of Tillé’s here. There’s a great quote here to highlight: “Representativeness means that the sample is a reduced model of the population. Representativeness is not a scientific argument to justify estimation; it is only an argument to justify witchcraft.”↩︎