Almost two years ago, I started working on the Survey of Doctorate Recipients sponsored by the National Science Foundation. Like many large national surveys, the Survey of Doctorate Recipients uses systematic sampling rather than the better-known method of simple random sampling which is ubiquitous in statistics and data science training. In conversations about this sample design, statisticians on the project repeatedly referred to something called “implicit stratification”, an unfamiliar term to me, and which was apparently something induced by the systematic sampling design.
This short post illustrates why systematic sampling is sometimes described as creating “implicit stratification”.
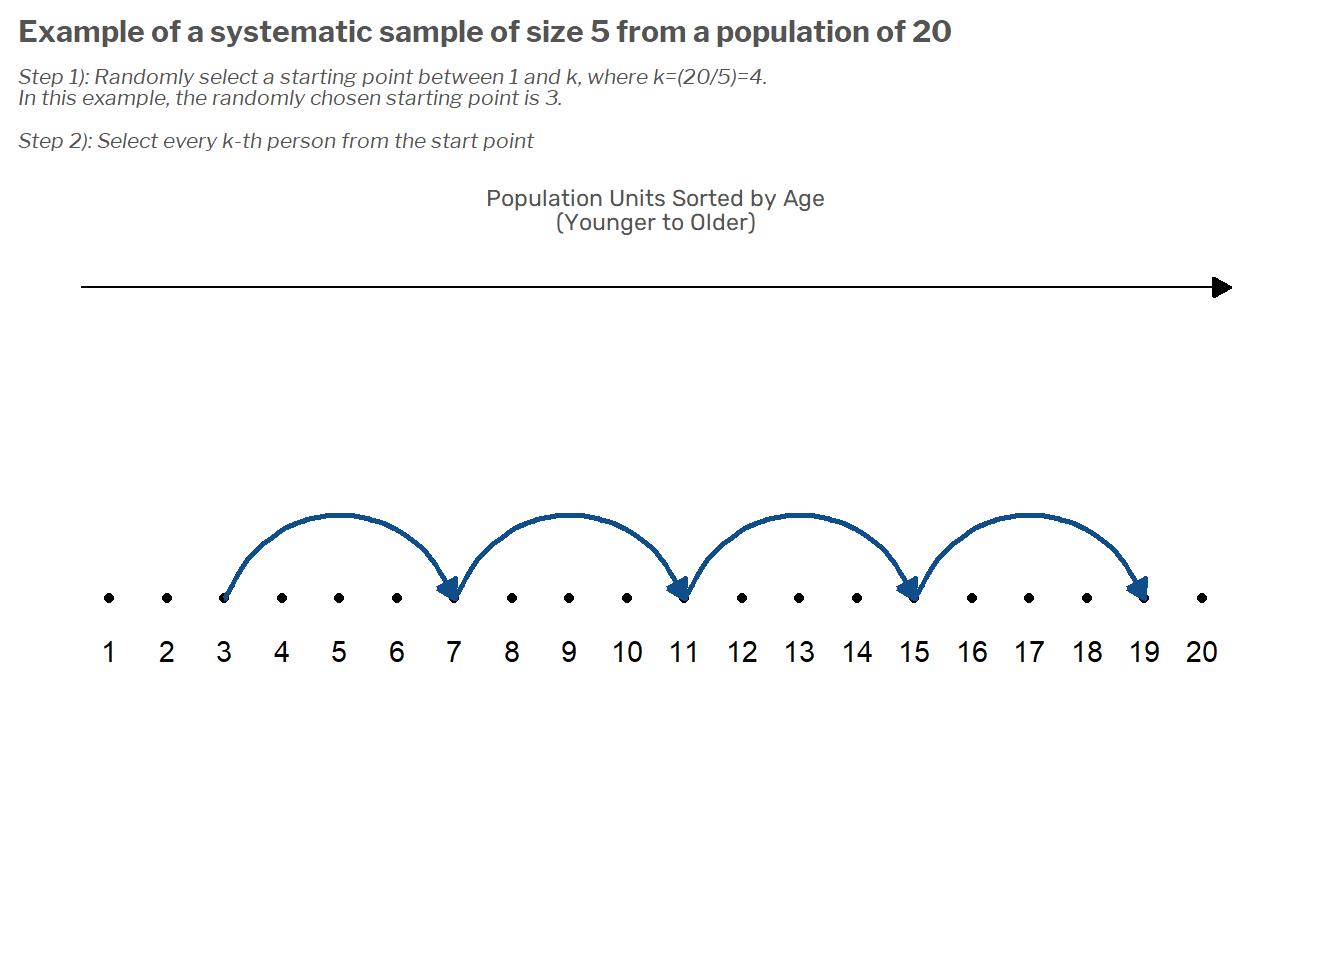
Suppose you have a list of 20 people from which you need to draw a sample of 5. To begin with, you’d sort the list by some factor such as age. Next, we’d randomly pick a starting point between 1 and 4 (i.e. between 1 and \(k=N/n\)). Our sample would consist of this starting point and then every k-th person from there. This is illustrated in the following figure.
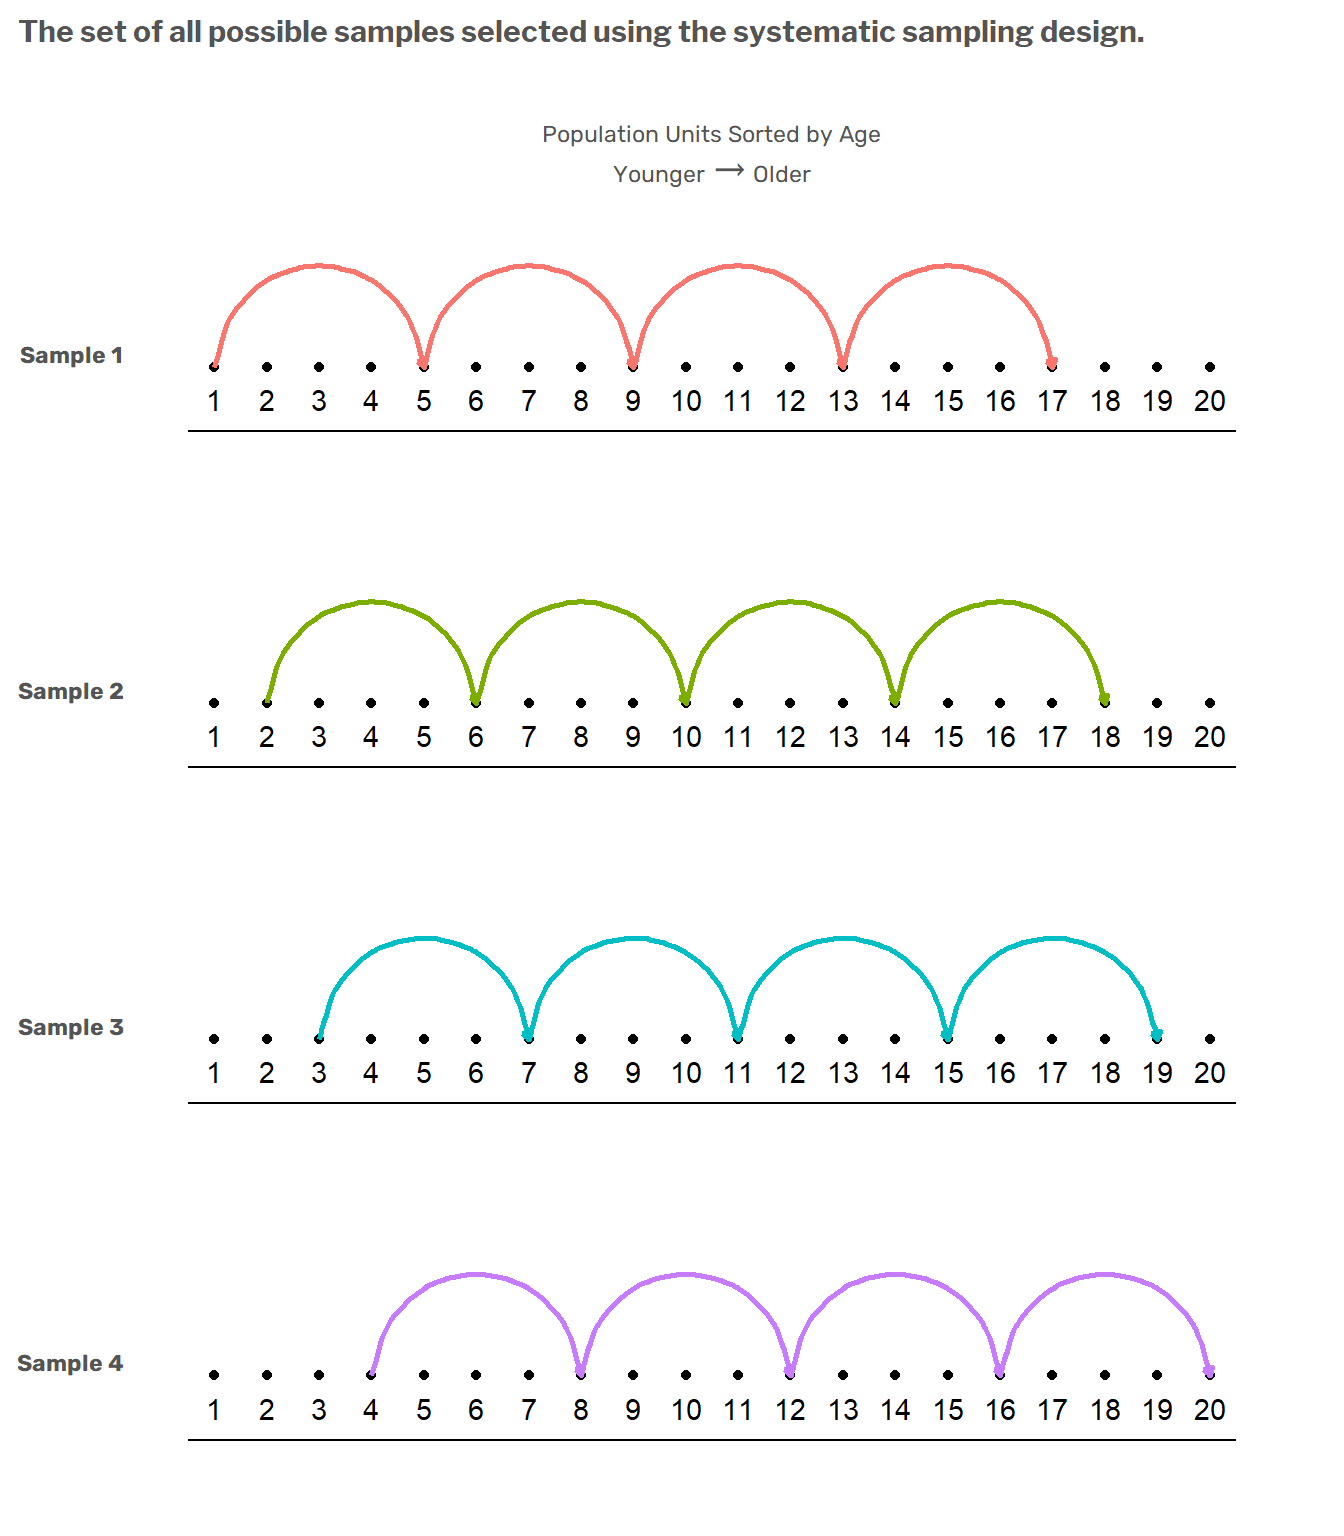
As the following figure illustrates, there are only four possible samples that can be selected under this design. The first sample is the set of elements 1,5,9,13,17; the second sample is the set of elements 2,6,10,14,18; etc.
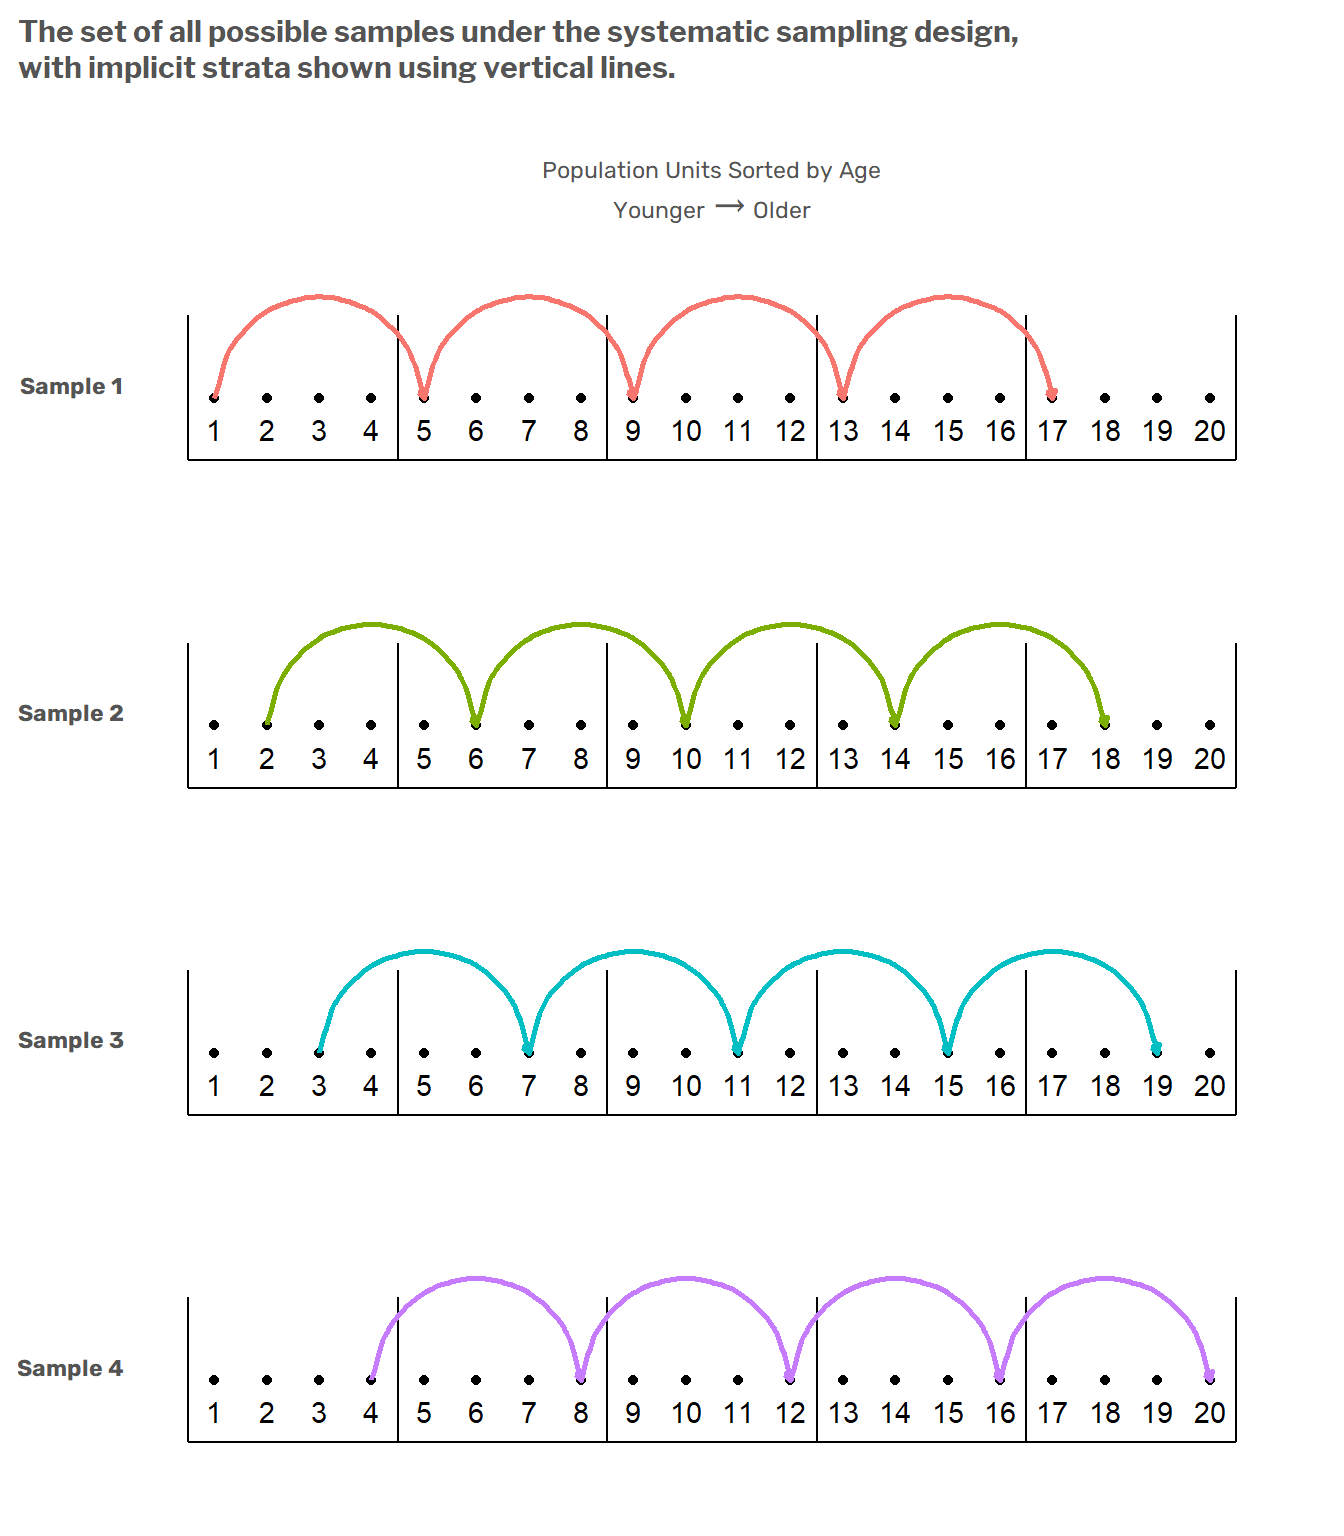
We can see in this illustration that in all of the possible samples, one and only element is included from the set \(\{1,2,3,4\}\), one and only one element is included from the set \(\{5,6,7,8\}\), and so on. Therein lies the implicit stratification. These \(5\) groups of \(20/4\) elements are implicit strata induced by the systematic sampling design. This is more apparent in the following figure.
This pattern is summarized nicely by William Cochran in the classic 1977 textbook “Sampling Techniques”:
In effect, [systematic sampling] stratifies the population into n strata, which consist of the first k units, the second k units, and so on. We might therefore expect the systematic sample to be about as precise as the corresponding stratified random sample with one unit per stratum.
(p. 205) Cochran’s “Sampling Techniques”, Third Edition
In contrast to explicit stratification, the implicit stratification induced by systematic sampling has a few advantages:
The strata don’t have to be defined using potentially arbitrary boundaries (e.g. Pew’s definitions of generations such as Millennials or Baby Boomers). The strata boundaries are implicitly determined by the overall population size and the overall sample size.
As a result, it’s straightforward to create implicit strata based on many variables in a list sampling frame: you simply sort the sampling frame by many variables.
Systematic sampling can be used even when you don’t have a list frame, such as in intercept surveys.
Systematic sampling can in fact yield more precise estimates than stratified simple random sampling, even when the explicit strata in the stratified SRS are the same as the implicit strata in the systematic design. I won’t get into the explanation, but Cochran’s book has a nice explanation on pages 205-207.
But implicit and explicit stratification aren’t mutually exclusive. In fact, it’s common to combine the two approaches by using systematic sampling within explicitly defined strata. That’s what the Survey of Doctorate Recipients (SDR) does. Explicit strata are formed based on PhD graduates’ field of study, gender, and race/ethnicity, and each stratum \(h\) is allocated a sample size \(n_h\) based on target margins of error for key estimates. Then within each explicitly-defined stratum \(h\), the individuals listed in the sampling frame are sorted by several other variables (age, for example) and a sample of size \(n_h\) is selected using systematic sampling.