Avoiding Negative Weights in the Generalized Bootstrap
The generalized bootstrap is a promising tool for survey data, but one of the key challenges with it in practice is that it can generate negative replicate weights. This post describes the challenges posed by negative weights and demonstrates an overlooked problem with the main solutions proposed to deal with it.
Why Negative Replicates Arise and Why They’re a Problem
In some recent blog posts, I’ve discussed how the generalized bootstrap is a promising tool for survey data. The key benefits are that the generalized bootstrap is much easier to use than the jackknife or balanced repeated replication (BRR). And compared to the jackknife, BRR, or even other bootstrap methods, the generalized bootstrap is applicable to a greater variety of common sampling designs used in practice, such as two-phase sampling and systematic sampling.
Unfortunately, a key drawback of the generalized bootstrap in practice is that it can generate negative replicate weights. Negative weights pose a few problems:
Often statistical software doesn’t know what to do with negative weights. When you give your software negative weights, it will often throw an error message or silently do something surprising like setting the negative weights to zero.
Negative weights are unintuitive for analysts. Weights are typically thought of as indicating the number of population units represented by a given sample unit: so what does it mean for a sample unit to represent a negative number of population units?
To get rid of negative weights, a few different statisticians have proposed using a rescaling method. The idea behind rescaling is to apply a simple transformation that ensures the weights are all nonnegative, and then account for this transformation by updating the replication factor(s) used to calculate variances based on the replicates.
Current Solutions for Getting Rid of Negative Replicate Weights
For example, Beaumont and Patak (2012) proposed the following rescaling method for sets of replicate weights for a sample of size . We’ll denote the matrix of replicate adjustment factors . The matrix might have some unfortuante negative elements. Beaumont and Patak’s proposal is to form a rescaled matrix of nonnegative replicate factors by rescaling each element of the matrix, , as follows: The value of is chosen simply as the smallest value needed to avoid negative weights. In other words, is chosen as the smallest value such that for all in and all in .
After applying this transformation, the bootstrap variance estimator no longer uses the overall scale factor for estimating variances: instead, it uses , since the transformation “deflates” the variability of the replicate factors by a constant , and we need to account for this in our variance estimation. So the bootstrap variance estimator before and after rescaling is as follows:
Prior to rescaling:
After rescaling:
Others have proposed similar kinds of rescaling methods for generalized replication methods. For example, in the 1984 paper where Bob Fay first proposed generalized replication (of which the generalized survey bootstrap is a special case), he suggested avoiding negative replicate weights by rescaling every replicate and using an updated overall scale factor. Kim and Wu (2013) suggested rescaling each replicate separately as needed. All of these rescaling methods are essentially the same, but the methods suggested by Bob Fay and Beaumont and Patak are generally easier for data users, since they only require analysts to keep track of the single rescaling factor rather than keeping track of a different rescaling factor for every single replicate.
The Problem with Current Solutions
The rescaling solutions proposed over the years work great for linear statistics, particularly means and totals. However, little if anything has been written about their performance for commonly-used non-linear or non-smooth statistics, such as quantiles, where the generalized bootstrap or generalized replication method without rescaling has been shown to work well.
Unfortunately, I’ve found that the rescaling methods lead to serious problems for quantiles, which are an important non-linear statistic commonly estimated from survey data. I would strongly suspect that these problems also extend to some other common social and economic indicators related to quantiles and empirical distribution functions, particularly poverty and inequality measures such as the “at-risk of poverty threshold” or the “relative median income ratio.”In the simulations included in this post, I show that–for estimating quantiles–the rescaling method leads to poor performance of confidence intervals formed using the percentile method, and it also leads to noticeable bias in standard error estimates.
In the rest of this post, I walk through the simulations that demonstrate the issues I’ve identified. Finally, I provide an explanation for why the rescaling method leads to poor confidence interval coverage.
Setting Up the Simulations
We’ll begin by defining a sampling frame, using example data from the ‘svrep’ package. This is a census of all public libraries in the United States, measuring characteristics such as the total number of visits, librarians, and book circulation.
Show R code
library(dplyr)library(survey)library(svrep)# Load example data from the SVREP packagedata('library_census', package ='svrep')# Create a sampling frame where variables of interest are nonmissingsampling_frame <- library_census |>filter(if_all(.cols =c(TOTCIR, TOTSTAFF, TOTINCM, VISITS, LIBRARIA),.fns = \(x) !is.na( x)))
The population quantity we want to measure is the 75% quantile for the number of librarians employed at a public library in the U.S.
First, we’ll define a function to draw a random sample according to a complex design: multistage sampling where the first stage is unequal probability sampling without replacement and the second stage is stratified simple random sampling without replacement.
Show R code
# Define a function to select a sample using a two-stage designdraw_sample <-function() {# Draw the first stage sample using PPSWOR sampling first_stage_pps_sample <- sampling_frame |>group_by(STABR, CBSA) |>summarize(PSU_ID =cur_group_id(),TOTCIR =sum(TOTCIR, na.rm =TRUE),N_LIBRARIES =n_distinct(FSCSKEY),.groups ="drop") |>ungroup() |>mutate(PSU_POP_SIZE =n(),PSU_SAMPLING_PROB = sampling::inclusionprobabilities(a = TOTCIR, n =100) ) |>mutate(FIRST_STAGE_SAMPLING_INDICATOR = sampling::UPbrewer(PSU_SAMPLING_PROB) ) |>filter(FIRST_STAGE_SAMPLING_INDICATOR ==1) |>select(STABR, CBSA, PSU_ID, PSU_SAMPLING_PROB, PSU_POP_SIZE)# Draw the second stage sample using SRSWOR within PSUs second_stage_sample <- library_census |>inner_join(y = first_stage_pps_sample,by =c("STABR", "CBSA")) |>arrange(PSU_ID, FSCSKEY) |>mutate(SSU_ID =row_number()) |>group_by(PSU_ID) |>mutate(SSU_POP_SIZE =n(),SSU_SAMPLING_PROB =case_when(n() ==1~1,TRUE~2/n()),SSU_SAMPLING_INDICATOR = sampling::srswor(n =case_when(n() ==1~1,TRUE~2),N =n()) ) |>ungroup() |>filter(SSU_SAMPLING_INDICATOR ==1) |>select(-SSU_SAMPLING_INDICATOR) |>mutate(SAMPLING_PROB = PSU_SAMPLING_PROB * SSU_SAMPLING_PROB) design_object <-svydesign(data = second_stage_sample,ids =~ PSU_ID + SSU_ID,fpc =~ PSU_SAMPLING_PROB + SSU_SAMPLING_PROB,pps ="brewer")return(design_object)}
Next, we define a function to estimate the 75% population quantile using three bootstrap methods:
The Rao-Wu-Yue-Beaumont (RWYB) bootstrap method implemented with the function as_bootstrap_design(type = "Rao-Wu-Yue-Beaumont")
The generalized bootstrap based on the “Deville-1” variance estimator for unequal-probability sampling designs.
The “rescaled generalized bootstrap”, which is a generalized bootstrap based on the “Deville-1” variance estimator but where the replicate factors have been rescaled to get rid of negative weights. See the ‘svrep’ package documentation for details.
With each method, we’ll estimate the following quantities:
The standard error of the quantile
A 95% confidence interval for the quantile, using the percentile method
For each confidence interval, we’ll note whether it covered the true population value and we’ll calculate its half-width, so we can see whether the confidence interval methods had the nominal coverage rate as well useful levels of precision.
Show R code
options("survey.replicates.mse"=TRUE)get_estimates <-function(selected_sample) {# Create generalized bootstrap replicates gen_boot_design <- selected_sample |>as_gen_boot_design(variance_estimator ="Deville-1",exact_vcov =TRUE, replicates =300,tau =1)# Create rescaled generalized bootstrap replicates rescaled_gen_boot_design <- gen_boot_design |>rescale_reps(tau =6)# For comparison, create bootstrap replicates using Rao-Wu-Yue-Beaumont method rwyb_bootstrap <- selected_sample |>as_bootstrap_design(type ="Rao-Wu-Yue-Beaumont", replicates =300 )# Produce all the estimates of interest, separately for each replication method compiled_estimates <-sapply(X =list('Generalized Bootstrap'= gen_boot_design,'Rescaled Generalized Bootstrap'= rescaled_gen_boot_design,'Rao-Wu-Yue-Beaumont Bootstrap'= rwyb_bootstrap),FUN =function(design_object) {# Quantiles with a confidence interval using the percentile methodsuppressMessages({ estimates <-svyquantile(x =~ LIBRARIA, na.rm =TRUE, qrule ="hf2",design = design_object, quantiles =0.75,interval.type ="quantile") }) point_estimate <-coef(estimates) std_error <- estimates |>SE()# Summarize the percentile confidence interval q_conf_interval <-confint(estimates)['LIBRARIA',] q_conf_half_width <-0.5*(q_conf_interval['u'] - q_conf_interval['l']) q_covered_true_value <-as.numeric( (pop_quantile >= q_conf_interval['l']) & (pop_quantile <= q_conf_interval['u']) )# Put all the estimates together into a single vectorc('estimate'=unname(point_estimate),'std_error'=unname(std_error),'interval_covered_true_value'=unname(q_covered_true_value),'interval_half_width'=unname(q_conf_half_width)) } )return(compiled_estimates)}
And now we’ll replicate this process of sampling and estimation a thousand times.
Show R code
set.seed(2023)# Set up parallel computinglibrary(future.apply)plan(multisession(workers =availableCores() -1))# Conduct simulations using parallel computing simulation_output <-future_replicate(n =1000, {draw_sample() |>get_estimates() })
Using the output from our simulations, we can evaluate the performance of the different bootstrap methods and confidence intervals computed from them.
Analyzing the Simulation Results
First, let’s look at the true standard error of the estimated quantile.
Show R code
# Calculate the 'true' standard error of estimatestrue_std_error <- simulation_output['estimate',1,] |>sd()print(true_std_error)
[1] 1.172072
Now let’s see how the true standard error compares to the average standard error estimate from each of the replication methods. Below, we can see that the best-performing method was the generalized bootstrap, without any rescaling to avoid negative weights. Surprisingly, the generalized bootstrap with rescaling to avoid negative weights performed noticeably worse, tending to substantially overestimate the standard error. The RWYB bootstrap did a good job, although it tended to slightly underestimate the standard error.
Now let’s see how each method performed in terms of the confidence intervals they produced. In the table below, we can see that none of the methods exactly attained the nominal coverage rate of 95%, although a couple of them came fairly close. The generalized bootstrap without rescaling did the best, with a coverage rate of 94%, and the RWYB bootstrap method did well too, with a coverage rate of 94%. Things are much worse for the generalized bootstrap which used rescaling to avoid the negative weights. The coverage rate for the rescaled generalized bootstrap is less than 83%, which is pretty bad performance for a 95% confidence interval method.
Understanding the Poor Confidence Interval Performance
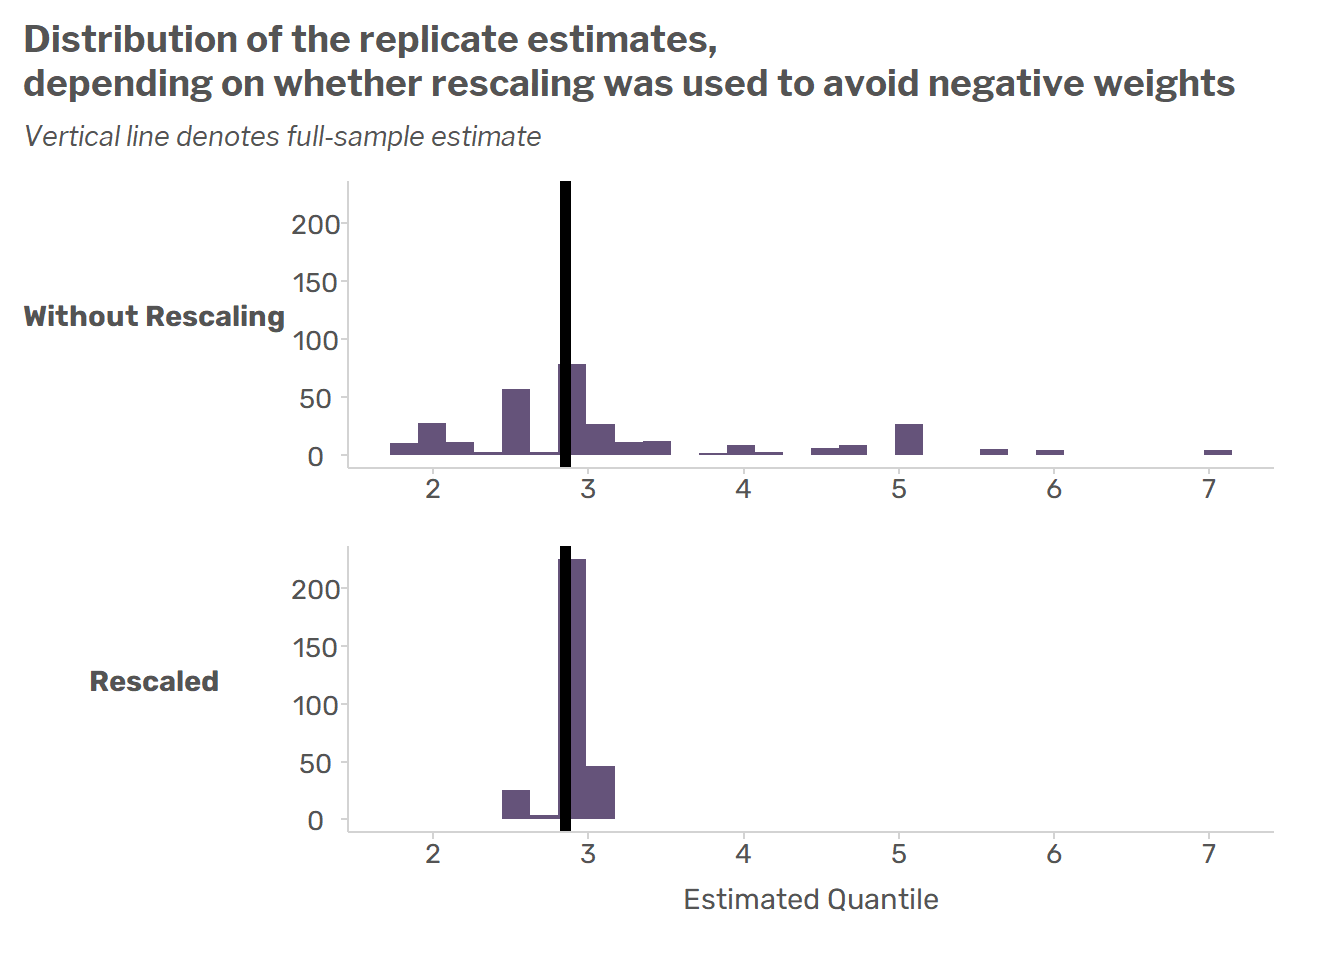
For the confidence intervals, it’s pretty easy to see what’s going wrong. When we rescale replication factors to avoid negative weights, effectively what we’re doing is compressing the distribution of the replicate factors, so that they’re more closely concentrated around their average (which is 1) and thus don’t end up crossing into the negative side of the number line. A consequence of this compression is that the difference between the 2.5% and 97.5% quantiles of the distribution of replicate estimates becomes very small, and so the resulting confidence intervals are too narrow to attain a 95% coverage rate.
We can see this by looking at a single sample. For this sample, we’ll create generalized bootstrap replicate weights. We’ll also produce a rescaled version of those replicate weights, so that none of the weights are negative.
Show R code
# Draw a samplerealized_sample <-draw_sample()# Create generalized bootstrap replicatesgen_boot_design <- realized_sample |>as_gen_boot_design(variance_estimator ="Deville-1",replicates =300, tau =1 )# Rescale the replicate weights,# to avoid having negative replicate weightsrescaled_gen_boot_design <- gen_boot_design |>rescale_reps()
Using the ‘survey’ package, we can estimate the quantile separately for each set of replicate weights.
Show R code
# Use the survey package to produce estimatesgen_boot_est <-svyquantile(design = gen_boot_design,x =~ LIBRARIA, na.rm =TRUE,qrule ="hf2",quantiles =0.75,interval.type ="quantile",return.replicates =TRUE)rescaled_gen_boot_est <-svyquantile(design = rescaled_gen_boot_design, x =~ LIBRARIA, na.rm =TRUE,qrule ="hf2", quantiles =0.75,interval.type ="quantile",return.replicates =TRUE)# Put all the replicate estimates into a single data frameestimates_by_replicate <-lapply(list('Without Rescaling'= gen_boot_est,'Rescaled'= rescaled_gen_boot_est), \(estimates) estimates$replicates |>as.vector()) |>bind_cols() |> tibble::rowid_to_column(var ="Replicate" )
And now we can see how the distribution of replicate estimates differs depending on whether we rescale the weights. After rescaling, the distribution of replicate weights is much more concentrated around the full sample estimate. That’s why the percentile method is performing so badly here.
Show R code
estimates_by_replicate |> tidyr::gather(key ="Method", value ="Estimate",-Replicate) |>mutate(Method =factor(Method, c("Without Rescaling","Rescaled"))) |>ggplot(aes(x = Estimate)) +geom_histogram(bins =30, alpha =0.75) +geom_vline(xintercept =as.numeric(gen_boot_est |>coef()),linewidth =2, linetype =1) + lemon::facet_rep_wrap(~ Method, ncol =1,repeat.tick.labels =TRUE,switch ="y") +labs(y =NULL,x ="Estimated Quantile",title =paste("Distribution of the replicate estimates,","depending on whether rescaling was used to avoid negative weights",sep ="\n" ),subtitle ="Vertical line denotes full-sample estimate" )
All of this only explains why the confidence interval method is performing poorly. Unfortunately, I’m still not sure why the standard error estimate has such a substantial upward bias when rescaling the weights. Maybe I’ll be able to follow up on that in a later post.