Recent articles on the huge increase in H-1B registrations have included a lot of numbers but no visualization. This post provides some much-needed visualization.
DISCLAIMER: This post, like all others on this website, reflect my personal views and not those of my employer.
Recently, I was dismayed to learn that a couple talented friends and co-workers were not selected in this year’s H-1B visa lottery, and would thus likely have to leave the U.S. This is a real loss for my organization, as these folks bring skills and unique perspectives that are hard to come by. The number of specially-trained survey methodologists and survey statisticians is fairly small, and it’s valuable to have staff with cross-cultural competencies and native Spanish language proficiency. Plus, these folks are just plain good at their jobs.
Anecdotally, I had heard that this was a much more “competitive” year for the lottery, but I hadn’t seen any explanation as to why. On Friday, the Wall Street Journal broke a fascinating story that explains why this year’s lottery was so weird. A few hours later, other news outlets published similar stories. Of the stories I’ve read so far, I think AP News seems to have done the best job explaining the data in an intuitive way.
The reporting from these two outlets did an excellent job contextualizing the numbers. However, I was surprised that there were no charts or tables included in the articles. Reading about the stark data patterns described in the articles, I was curious to see what they might look like in data visualizations. So this blog post represents my attempt to visualize the reporting from these articles.
For those who don’t want to read the details of getting the data and visualizing it, here are the visualizations and my main takeaways from the data and reporting I’ve seen.
For me, the main takeaways from the data and the reporting I’ve read so far are the following:
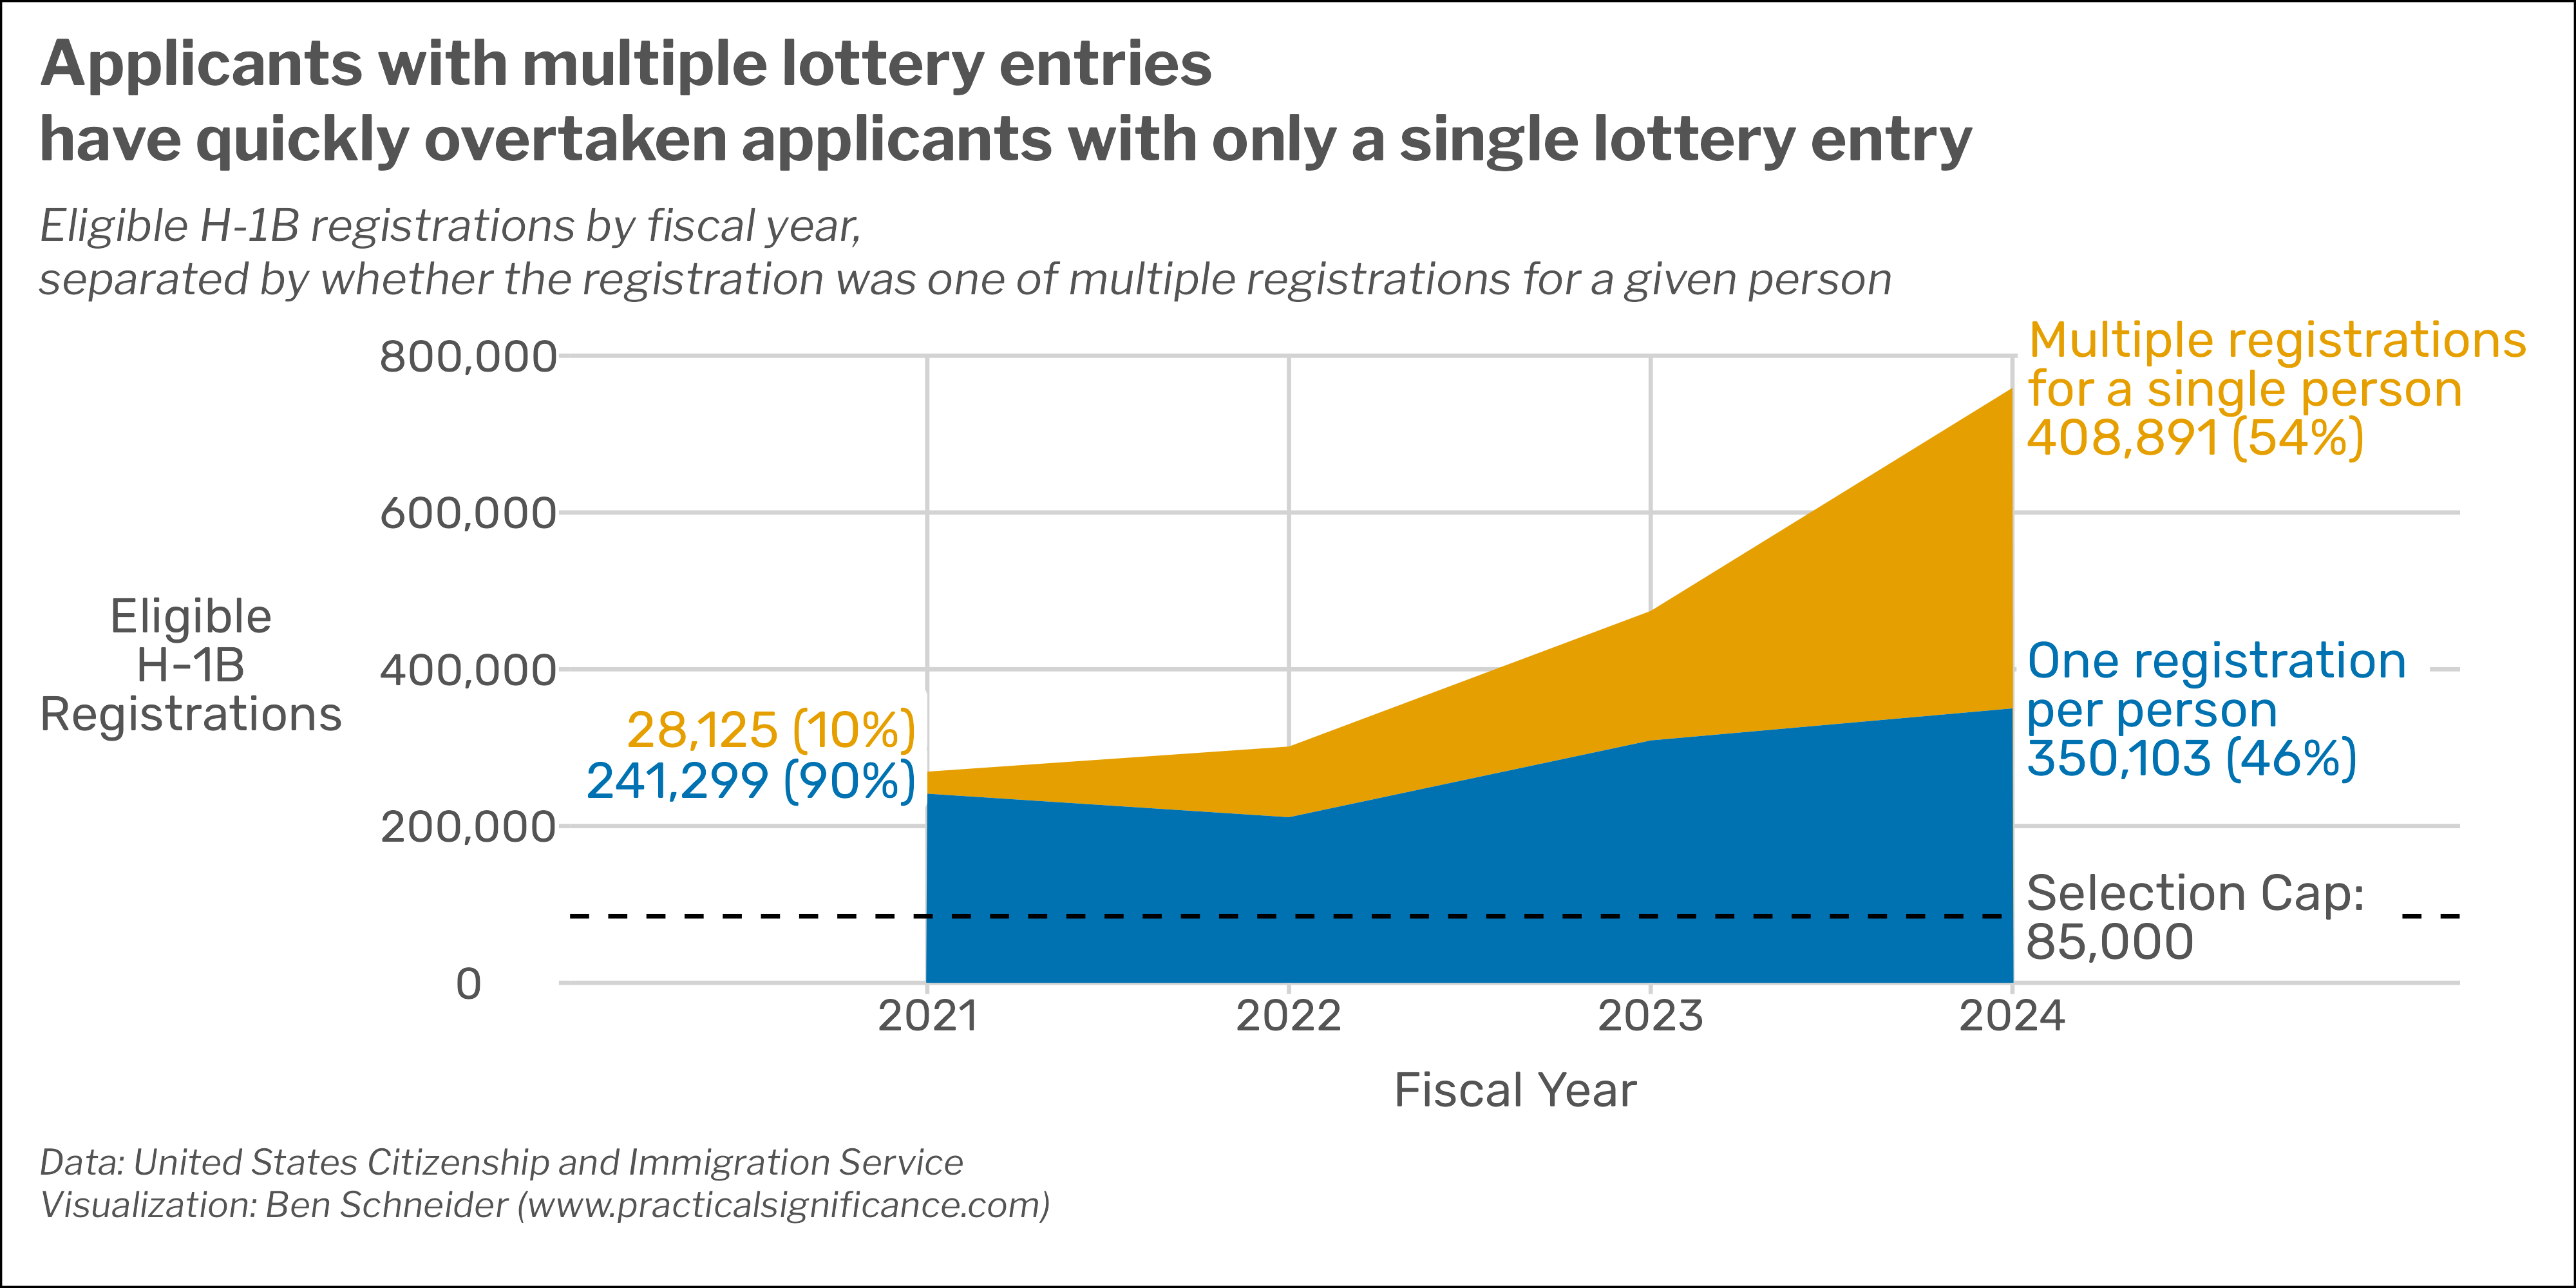
The sad result is that most lottery winners this year were applicants who submitted multiple lottery entries, and these applicants drastically reduced the lottery chances for those who only submitted a single registration If not for the rise in duplicate, likely-fradulent registrations, someone who submitted a single H-1B registration would have had a roughly 22% chance of being granted an H-1B visa this year. But due to the increase in multiple registrations, they only have about an 11% chance this year. In other words, the massive increase in multiple registrations has roughly halved a legitimate applicant’s chances of receiving an H-1B visa this year.
This situation is beyond frustrating and has caused serious harm to legitimate H-1B applicants and the U.S. companies and citizens who want to work with them. I hope that USCIS and law enforcement agencies are able to improve the situation for this year’s legitimate H-1B applicants and prevent this fraud in the future. At the very least, one would hope that in the future USCIS learns how to de-duplicate their list of registrations before conducting their lottery. Failing to do so was perhaps defensible back in FY2021 when only 10% of H-1B registrations were duplicates, but it’s asinine that USCIS is rewarding fraudulent applicants by letting them double or triple their lottery odds through multiple registrations.
If you too are frustrated by this situation and want USCIS and Congress to redress the harm caused by the rise in fraudulent registrations, I’d encourage you to reach out to your representatives in Congress:
Below is a draft email you can edit to send to your representatives:
Dear [Representative/Senator X],
I’m writing with concern after learning about the unprecedented level of fraud that affected this year’s H-1B visa lottery. Here in [X], local businesses and communities are being substantially harmed by the massive disruption to this year’s H-1B lottery caused by illegal collusion. I urge you to take action to ensure that U.S.C.I.S. and federal law enforcement agencies will not only prevent this fraud in future years, but also redress the enormous damage caused this year.
U.S.C.I.S. should have provided every individual applicant the same chance of being awarded a visa in this year’s lottery, but instead allowed fraudulent applicants to ‘game the system’ by submitting multiple registrations and thus double or quadrupling their changes in this year’s lottery, at the expense of thousands of law-abiding applicants and the U.S. businesses who sought to employ them. Congress and U.S.C.IS. should end this vulnerability by ensuring that future lotteries assign each applicant–rather than each registration–an equal chance of being selected for an H-1B visa.
Congress should also ensure that law enforcement works with utmost urgency to identify and cancel the selections of fraudulent applicants, in addition to prosecuting the fraudulent businesses who enabled these fraudulent application.
All of these steps are necessary to prevent this issue going forward. However, I urge you to take action to remedy the harm that has already occurred due to our system’s vulnerability and those who have taken advantage of it. Hundreds of thousands of workers and businesses have already been harmed by this year’s fraud, and it is up to U.S.C.I.S. and Congress to offer a second chance for businesses to retain the highly-skilled workers whom we stand to lose this year.
Our community and its economy are strengthened by our ability to obtain highly-skilled workers through the H-1B system. Their talents are an important part of our nation’s ability to lead the world in technological innovation, and their contributions benefit all of America.
I hope you will take this issue seriously.
Sincerely,
[YOUR NAME]
Anyway, for those that are interested, the rest of this blog post contains the details of getting and visualizing the data which–to its credit–USCIS transparently shared on its website in an easy-to-access fashion.
Getting the Data
The first step in visualization is obtaining the data. Fortunately, after letting the Wall Street Journal peek at the data, USCIS publicly shared the underlying data for these stories on their website, here:
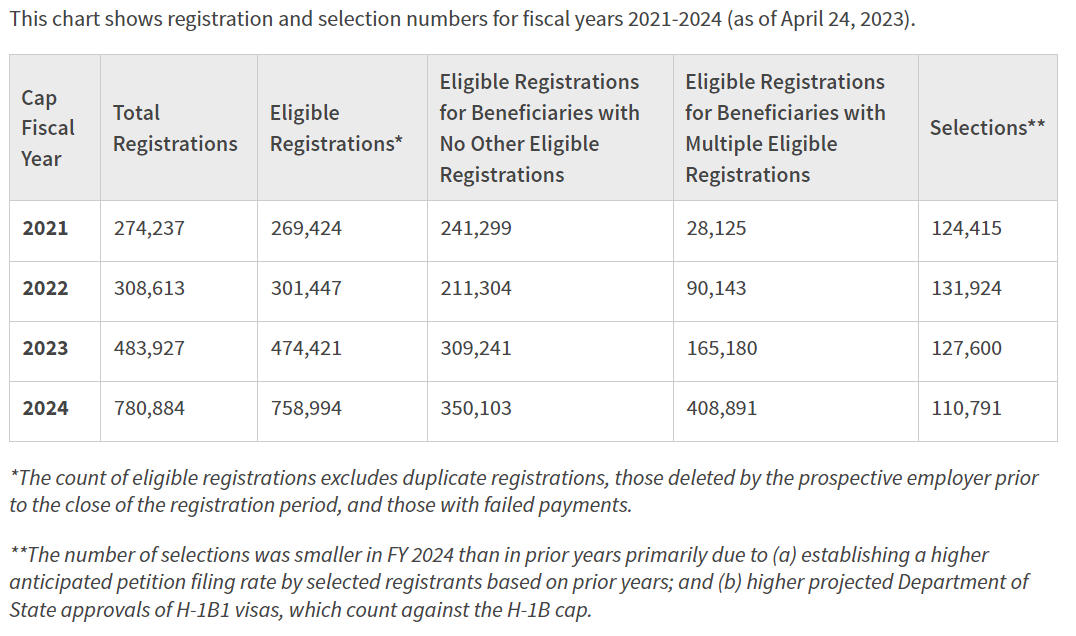
Here’s a screenshot of the key table of data that was reported on in the news articles.
I loaded this table into R by copying and pasting the table with the clipr package, renaming the columns for readability, and using the readr function parse_number() to tell R that the columns with commas are actually numbers.
For these visualizations, I’ll use the popular R package ggplot2. I’ll use my personal R package, schneidr, to pretty up the default styles used for the plots.
Here’s a first pass at visualizing the headline from the AP News story. This plot shows the overall number of H-1B registrations and how they’ve rapidly dwarfed the total number of H-1B visas that are actually available.
Show R code
registrations_plot <- uscis_summary_table |>ggplot(aes(x = Fiscal_Year, y = Total_Registrations)) +# Add a trend-linegeom_line(color = schneidr::schneidr_purple(),linewidth =1.5) +# Add a horizontal line and annotation# for the selection cap of 85,000geom_hline(yintercept =85000, linetype =2) +geom_label(aes(x =2021, y =85000, label ="Selection Cap: 85,000"), hjust =0, vjust =0.5, lineheight =0.8, label.size =NA,colour ="#555555", fill ="white", family="Rubik", size =4) +# Set a scale for the y axisscale_y_continuous(labels = scales::label_comma(),limits =c(0, 8*10^5),expand =c(0, 0)) +# Add titles, labels, and captionslabs(x ="Fiscal Year",y ="H-1B<br>Registrations",title ='AP News: "The number of applications for visas used in the technology industry\nsoared for a second straight year"',subtitle ="Total H-1B registrations by fiscal year",caption ="Data: United States Citizenship and Immigration Service\nHeadline: Elliot Spagat, AP News\nVisualization: Ben Schneider (www.practicalsignificance.com)" ) +theme(plot.background =element_rect(fill ="white"))registrations_plot
However, the truly interesting part of the story is not just that the number of total registrations has rapidly increased; what’s truly interesting is why. As the journalists at the AP News and Wall Street Journal noted, the bulk of the rise in H-1B registrations is driven by a staggering increase in what one might call ‘duplicate’ registrations– that is, multiple registrations submitted for a single person. In FY2021, such registrations accounted for 10% of the total H-1B registrations going into the lottery. In FY2024, those ‘duplicate’ registrations account for a staggering 54% of the total H-1B registrations. While some of these ‘duplicate’ entries are perfectly legitimate (i.e., were entered by multiple companies competing to snag the same highly skilled applicant), the initial journalistic reporting as well as the comments from USCIS suggest that the vast majority of the duplicate entries are fraudulent submissions used to illegally boost an applicant’s changes of being selected in the H-1B lottery.
The sad result is that most lottery winners this year were applicants who submitted multiple lottery entries, and these applicants drastically reduced the lottery chances for those who only submitted a single registration If not for the rise in duplicate, likely-fradulent registrations, someone who submitted a single H-1B registration would have had a roughly 22% chance of being granted an H-1B visa this year. But due to the increase in multiple registrations, they only have about an 11% chance this year. In other words, the massive increase in multiple registrations has roughly halved a legitimate applicant’s chances of receiving an H-1B visa this year.
Click to show the rough math
Here’s the rough underlying math. In FY2021, 85,000 H-1B visas were allocated among 269,424 registrations, 241,299 were unique to only one respective person. So each of these 241,299 single-registration applicants had a () chance of receiving one of the available H-1B visas. In FY2024, the number of single-registration applications rose to .
If the share of multiple-registrations in FY2024 was the same as in FY2021, there would have been a total of registrations in FY2024. So the single-registration applicants would have each had a () chance of receiving one of the available H-1B visas. But in FY2024, the single-registration applicants each had a () chance of receiving an available visa.
These calculations are rough because not all of the eligible registrations will end up receiving an H-1B even if they win the lottery, and USCIS selects more than registrations in their lottery to account for this.
Show R code
# Prepare the data for visualizationplot_data <- uscis_summary_table |>select(Fiscal_Year, `Single`= Eligible_Single_Reg_Beneficiaries,`Multiple`= Eligible_Multi_Reg_Beneficiaries) |> tidyr::pivot_longer(cols =matches("Single|Multiple"),names_to ="Registration_Type",values_to ="Beneficiaries" ) |>group_by(Fiscal_Year) |>mutate(Percent = Beneficiaries/sum(Beneficiaries)) |>mutate(Label = glue::glue("{scales::comma(Beneficiaries)} ({scales::percent(Percent, 1)})" ),Label =ifelse(Fiscal_Year %in%c(2021, 2024), Label, NA_character_),Label =case_when( Fiscal_Year ==2024& Registration_Type =="Multiple"~paste0("Multiple registrations\nfor a single person\n", Label ), Fiscal_Year ==2024& Registration_Type =="Single"~paste0("One registration\nper person\n", Label ),TRUE~ Label ),Label_Position =ifelse( Registration_Type =="Multiple", sum(Beneficiaries), Beneficiaries ) ) |>ungroup()# Produce the plot using ggplot2# Produce the plot using ggplot2plot_data |>ggplot(aes(x = Fiscal_Year, y = Beneficiaries)) +# Area for each registration typegeom_area(aes(fill = Registration_Type)) +geom_label(aes(y = Label_Position,label = Label, colour = Registration_Type,hjust =ifelse(Fiscal_Year ==2024, -0.01, 1),vjust =case_when( Fiscal_Year ==2021& Registration_Type =="Multiple"~-0.25, Fiscal_Year ==2021& Registration_Type =="Single"~0.25,TRUE~0.5 )),fill ="white", lineheight =0.8, label.size =NA,family="Rubik", size =4) +# Add a horizontal line and annotation# for the selection cap of 85,000geom_hline(yintercept =85000, linetype =2) +geom_label(aes(x =2024, y =85000, label ="Selection Cap:\n85,000"), hjust =-0.01, vjust =0.5, lineheight =0.8, label.size =NA,colour ="#555555", fill ="white", family="Rubik", size =4) +# Set a scale for the y axisscale_y_continuous(labels = scales::label_comma(),limits =c(0, 8*10^5),expand =c(0, 0)) +# Set a scale for the x axisscale_x_continuous(limits =c(2020.25, 2025),breaks =c(2021:2024),labels =c(2021:2024)) +# Improve the legendscale_colour_manual(name ="Registration Type:",values =c("#E69F00", "#0072B2"),labels =c("Multiple registrations for a single person","Single registration for a single person") ) +scale_fill_manual(name ="Registration Type:",values =c("#E69F00", "#0072B2"),labels =c("Multiple registrations for a single person","Single registration for a single person") ) + schneidr::theme_schneidr(base_size =10,axis_lines =FALSE, grid_lines =TRUE,markdown_elements ="axis title" ) +theme(legend.position ="none",plot.background =element_rect(fill ="white")) +coord_cartesian(clip ='off') +# Add titles, labels, and captionslabs(x ="Fiscal Year",y ="Eligible<br>H-1B<br>Registrations",title ='Applicants with multiple lottery entries\nhave quickly overtaken applicants with only a single lottery entry',subtitle ="Eligible H-1B registrations by fiscal year,\nseparated by whether the registration was one of multiple registrations for a given person",caption ="Data: United States Citizenship and Immigration Service\nVisualization: Ben Schneider (www.practicalsignificance.com)" )