Visualizing the H-1B Fraud Spike and the Impact of Lottery Rule Changes
This year’s change in H-1B lottery rules put an end to the spike in companies submitting multiple fraudulent lottery entries for individual applicants. This post visualizes the stark pattern in the published data from USCIS.
The year 2023 was one of the worst years in history to be an H-1B applicant, if you weren’t a fraudster. That year (technically, federal fiscal year 2024) saw a massive spike in likely-fraudulent applications, to the point that most H-1B lottery winners were applicants who submitted multiple, likely-fraudulent registrations. I wrote about this story in a previous blog post, with references to some good pieces of reporting from that year:
Fraudulent applications in recent years spiked in large part because the H-1B registration process became greatly simplified in 2021: to enter the H-1B lottery, applicants no longer had to file lengthy, detailed applications that required costly lawyer hours to prepare. Instead, companies could pay a $10 registration fee, fill out some simpler forms, and pay almost all of the legal costs only if the applicant won the lottery.
Ultimately, though, fraudulent companies were able to game the lottery because of a big, obvious problem in the H-1B lottery system: if an applicant got multiple potential employers to submit H-1B registrations, they could double (or more than double) their chances of winning the lottery. In one instance, a person had 83 registrations made by fraudulent companies for them, giving them an ~ 830% greater chance of winning the H-1B lottery compared to a genuine applicant with one legitimate job offer. Nearly all of these multiple registrations were not situations where a highly-talented employee was sought after by multiple legitimate employers. Rather, these were instances where fraudulent “shell companies” were used to file multiple fraudulent registrations based on jobs that didn’t actually exist, so that just one actual, fraudulent company could hire the fraudulent applicant.
Thankfully the Biden administration fixed the problem with multiple registrations, in time for the H-1B lottery whose results were announced this year. And, to its credit, USCIS was transparent about the problem and the agency did what it could to get attention to the problem so that policymakers would work to address it. Beginning with this last H-1B lottery, USCIS changed the lottery selection process so that each applicant would get “only one ticket in the hat.”
Now that the lottery results for FY2025 have been announced, USCIS has released updated data on the registrations it received, and news outlets have written about the stark drop in multiple registrations. But there’s been surprisingly little data visualization to show this stark drop.
So here are a couple simple charts showing how the prevalence of multiple registrations has sharply dropped.
I’m happy to see that the Biden administration fixed this big problem with the H-1B lottery process. And on a personal note, I’m also happy for the H-1B applicants I personally know who’ve actually made it through this year’s lottery.
For those interseted, the remainder of this post shows the details of getting and visualizing the data, which USCIS–again, to its credit–transparently published on its website.
Getting the Data
The first step in visualization is obtaining the data. Fortunately, after letting the Wall Street Journal peek at the data, USCIS publicly shared the underlying data for these stories on their website, here:
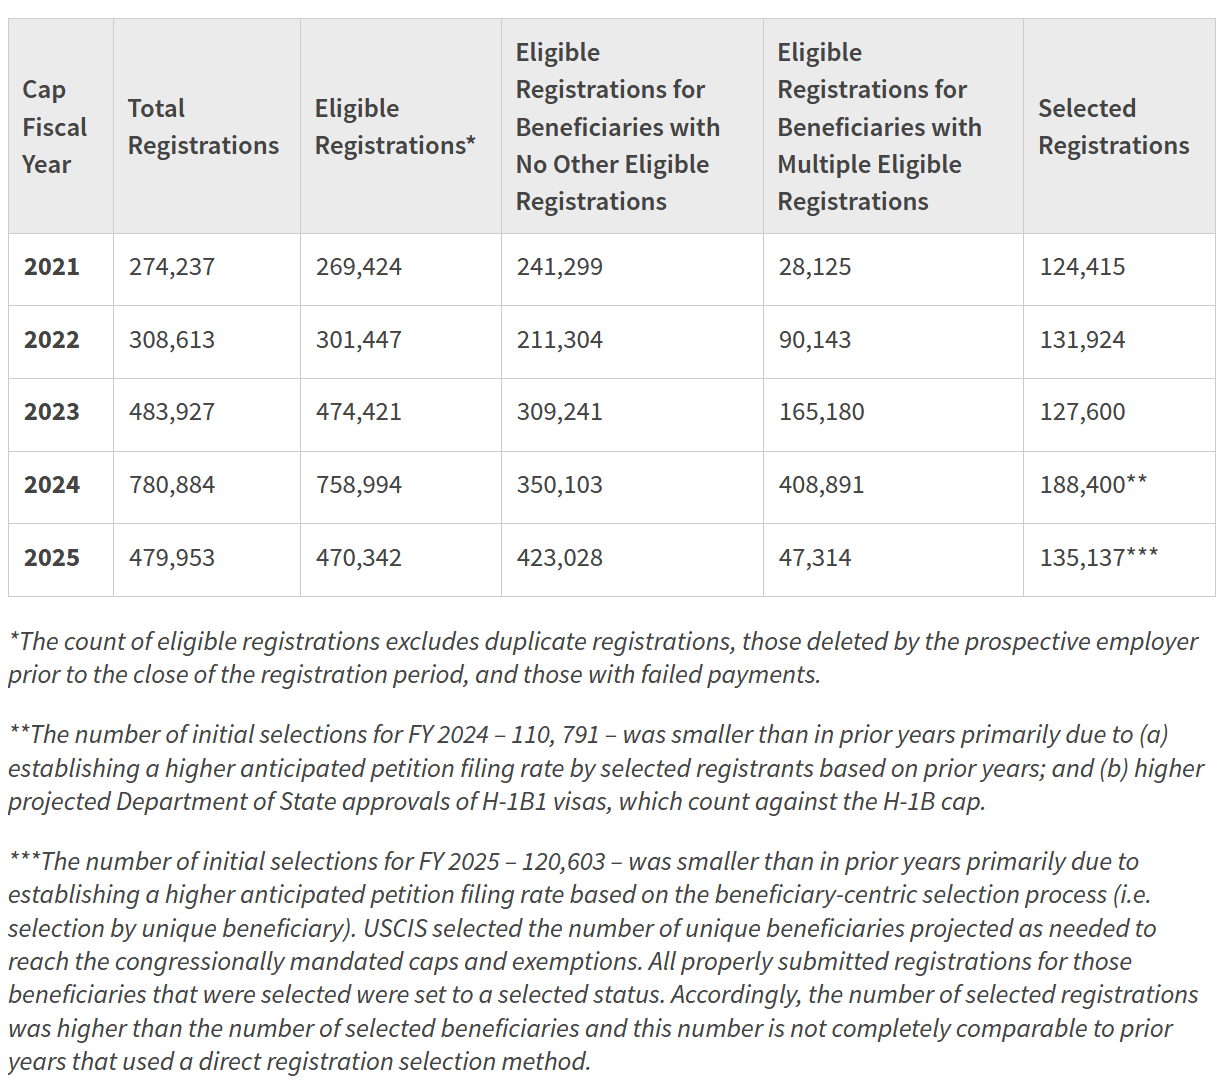
Here’s a screenshot of the key table of data that was reported on in the news articles.
I loaded this table into R by copying and pasting the table with the clipr package, renaming the columns for readability, and using the readr function parse_number() to tell R that the columns with commas are actually numbers.
For these visualizations, I’ll use the popular R package ggplot2. I’ll use my personal R package, schneidr, to pretty up the default styles used for the plots.
The plot below shows the overall number of H-1B registrations and how they’ve rapidly dwarfed the total number of H-1B visas that are actually available.
Show R code
registrations_plot <- uscis_summary_table |>ggplot(aes(x = Fiscal_Year, y = Total_Registrations)) +# Add a trend-linegeom_line(color = schneidr::schneidr_purple(),linewidth =1.5) +# Add a horizontal line and annotation# for the selection cap of 85,000geom_hline(yintercept =85000, linetype =2) +geom_label(aes(x =2021, y =85000, label ="Selection Cap: 85,000"), hjust =0, vjust =0.5, lineheight =0.8, label.size =NA,colour ="#555555", fill ="white", family="Rubik", size =4) +# Set a scale for the y axisscale_y_continuous(labels = scales::label_comma(),limits =c(0, 8*10^5),expand =c(0, 0)) +# Add titles, labels, and captionslabs(x ="Fiscal Year",y ="H-1B<br>Registrations",title ='The spike in total H-1B registrations has ended due to FY2025 rule changes',subtitle ="Total H-1B registrations by fiscal year",caption ="Data: United States Citizenship and Immigration Service\nVisualization: Ben Schneider (www.practicalsignificance.com)" ) +theme(plot.background =element_rect(fill ="white"))print(registrations_plot)
The plot below breaks down the total registrations into single registrations for an applicant versus multiple registrations for an applicant.
Show R code
# Prepare the data for visualizationplot_data <- uscis_summary_table |>select(Fiscal_Year, `Single`= Eligible_Single_Reg_Beneficiaries,`Multiple`= Eligible_Multi_Reg_Beneficiaries) |> tidyr::pivot_longer(cols =matches("Single|Multiple"),names_to ="Registration_Type",values_to ="Beneficiaries" ) |>group_by(Fiscal_Year) |>mutate(Percent = Beneficiaries/sum(Beneficiaries)) |>mutate(Label = glue::glue("{scales::comma(Beneficiaries)} ({scales::percent(Percent, 1)})" ),Label =ifelse(Fiscal_Year %in%c(2021, 2024, 2025), Label, NA_character_),Label =case_when( Fiscal_Year ==2025& Registration_Type =="Multiple"~paste0("Multiple registrations\nfor a single person\n", Label ), Fiscal_Year ==2025& Registration_Type =="Single"~paste0("One registration\nper person\n", Label ),TRUE~ Label ),Label_Position =ifelse( Registration_Type =="Multiple", sum(Beneficiaries), Beneficiaries ) ) |>ungroup()# Produce the plot using ggplot2multiple_registrations_plot <- plot_data |>ggplot(aes(x = Fiscal_Year, y = Beneficiaries)) +# Area for each registration typegeom_area(aes(fill = Registration_Type)) +geom_label(aes(y = Label_Position,label = Label, colour = Registration_Type,hjust =ifelse(Fiscal_Year ==2025, -0.01, 1),vjust =case_when( Fiscal_Year ==2021& Registration_Type =="Multiple"~-0.25, Fiscal_Year ==2021& Registration_Type =="Single"~0.25, Fiscal_Year ==2025& Registration_Type =="Multiple"~-0.25,TRUE~0.5 )),fill ="white", lineheight =0.8, label.size =NA,family="Rubik", size =4) +# Add a horizontal line and annotation# for the selection cap of 85,000geom_hline(yintercept =85000, linetype =2) +geom_label(aes(x =2025, y =85000, label ="Selection Cap:\n85,000"), hjust =-0.01, vjust =0.5, lineheight =0.8, label.size =NA,colour ="#555555", fill ="white", family="Rubik", size =4) +# Set a scale for the y axisscale_y_continuous(labels = scales::label_comma(),limits =c(0, 8*10^5),expand =c(0, 0)) +# Set a scale for the x axisscale_x_continuous(limits =c(2020.25, 2026),breaks =c(2021:2025),labels =c(2021:2025)) +# Improve the legendscale_colour_manual(name ="Registration Type:",values =c("#E69F00", "#0072B2"),labels =c("Multiple registrations for a single person","Single registration for a single person") ) +scale_fill_manual(name ="Registration Type:",values =c("#E69F00", "#0072B2"),labels =c("Multiple registrations for a single person","Single registration for a single person") ) + schneidr::theme_schneidr(base_size =10,axis_lines =FALSE, grid_lines =TRUE,markdown_elements ="axis title" ) +theme(legend.position ="none",plot.background =element_rect(fill ="white")) +coord_cartesian(clip ='off') +# Add titles, labels, and captionslabs(x ="Fiscal Year",y ="Eligible<br>H-1B<br>Registrations",title ='The spike in multiple H-1B lottery entries has ended due to the FY2025 rule changes',subtitle ="Eligible H-1B registrations by fiscal year,\nseparated by whether the registration was one of multiple registrations for a given person",caption ="Data: United States Citizenship and Immigration Service\nVisualization: Ben Schneider (www.practicalsignificance.com)" )multiple_registrations_plot